Policy and Report Library > Reports > 2008 Performance Measurement Report
Note: The following is a representation of the Performance Measurement outcomes for the State College segment as a whole. Where appropriate and useful, we provide institution-level summaries. For additional information regarding the indicator methodologies and details, please refer to the Community College Technical Guide.
Access Indicators
Affordability Indicators
Student Success and Academic Quality Indicators
Fiscal Effectiveness and Efficiency Indicators
| Headcount | 84,703 |
| FTE | 51,257 |
Over the last three years fall headcount enrollment has increased 5.1%. Four colleges had relatively flat growth, ten colleges showed in increase, and one college declined.
Over the last three years fall FTE enrollment has increased 5.6%. Four colleges had relatively flat growth, nine colleges showed in increase, and two colleges declined.
| Headcount | 121,507 |
| FTE | 53,705 |
Over the last three years annual headcount enrollment has increased 5 percentage points. Two colleges had relatively flat growth, twelve colleges showed in increase, and one college declined.
Over the last three years annual FTE enrollment has increased 5.7 percentage points. Five colleges had relatively flat growth, nine colleges showed in increase, and one college declined.
28.9%
The Community College minority representation is more than ten percentage points higher than the Commonwealth’s minority composition of 16.1% (based on adults 18 and over).13 of the 15 colleges had minority representation that was comparable to or greater than that of their primary draw cities and towns. 14 of the 15 colleges had minority representation that was comparable to or greater than that of their geographic regions.
4.7%
The Community College segment was comparable to the Northeast regional average of 4.9%. All colleges were within one percentage point of the Northeast regional average.
| FY2004 | FY2005 | FY2006 | FY2007 | FY2008 | |
|---|---|---|---|---|---|
| Massachusetts Community Colleges' Average Tuition and Fees | $3,265 | $3,380 | $3,477 | $3,526 | $3,661 |
| Massachusetts Median Family Income | $67,527 | $68,701 | $71,655 | $74,463 | $78,497 |
| Massachusetts Community Colleges' Average Tuition and Fees as a Percent of State Median Family Income | 4.8% | 4.9% | 4.9% | 4.7% | 4.7% |
| Northeast Average Tuition and Fees | $2,971 | $3,063 | $3,294 | $3,428 | |
| Northeast Median Family Income | $62,052 | $64,147 | $66,601 | $70,423 | |
| Northeast Average Tuition and Fees as a Percent of Northeast Median Family Income | 4.8% | 4.8% | 4.9% | 4.9% |
| Retained at original institution | 56.6% |
| Retained at any institution | 65.3% |
The Community College segmental retained at original institution rate has remained relatively stable over the last three years. Eleven of the fifteen colleges had relatively stable or increasing retention rates over the last three years.
The DHE now reports the percent of community college students who enroll at any institution the fall after initial enrollment because transfer is key aspect of the community college mission. Approximately 8.8% of the 2006 cohort enrolled at an institution other than their original in fall 2007.
71.9%
| Earned Degree/Certificate | 34.4% |
| Transferred | 15.7% |
| Earned 30 Credits | 20.0% |
| Still Enrolled | 1.7% |
| Note: Each subsequent category excludes any student included in previous category(ies) | |
This new indicator measures students who have earned a degree/certificate, transferred to another institution, earned 30 or more credits, or are still enrolled after four years. Future reports will include these outcomes over four, five, and six years for this and successive cohorts. Please see the Technical Guide for further details regarding this indicator.
90.8%
The Community College segmental fall-to spring retention rate has remained relatively stable over the last three years. 13 of the 15 colleges had relatively stable or increasing retention rates over the last three years.
76.1%
The Community College segmental completion rate was above the Board of Higher Education’s target rate of 75%. 13 of the 15 colleges had rates that were comparable to or higher than the target.
10,742
• Average degrees conferred per year over the last three years: 10,474. All 15 colleges conferred degrees at a level comparable to or above their three-year average.
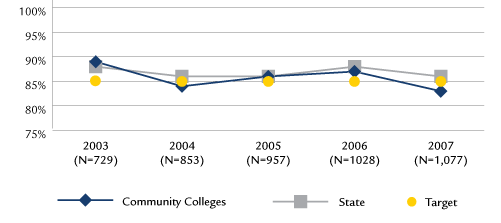
83.4%
The Community College segment’s nursing licensure pass rate was comparable to the Board of Higher Education’s target pass rate of 85%. Ten of 15 colleges had pass rates comparable to or above 85%.

86,683
Average Annual Enrollment in workforce development courses per year over the last three years: 87,848. 12 of the 15 colleges had an enrollment total comparable to or above their three-year average.
All 15 community colleges had unqualified audits with no material weaknesses.
The Board of Higher Education requires that all audits are unqualified with no significant findings.
None of the community colleges had a Primary Reserve Ratio comparable to the advisable level of reserves.
$12,144,372
Community Colleges raised slightly less in FY2008 than in FY2007. However, this is the second highest total raised in the last seven years.