Policy and Report Library > Reports > 2008 Performance Measurement Report
Salem State College
Salem State College offers baccalaureate and graduate degree programs responsive to the needs of a wide spectrum of individuals and to the needs of the Commonwealth. The College is committed to offering an education that provides a solid foundation for lifelong learning and development and to building a community that includes people of all ages, races, and socioeconomic backgrounds.
Program of Distinction
Collaborations
Access Indicators
Affordability Indicators
Student Success and Academic Quality Indicators
Fiscal Effectiveness and Efficiency Indicators
Program of Distinction
The Direct Entry Program (DEP) in Nursing at Salem State College was established through a state appropriation for the purpose of increasing the number of licensed nurses in the Commonwealth. The first cohort of students entered the program in Summer 2006. Since that time, two cohorts totaling 24 students have graduated from the program with a 100% NCLEX pass rate. Graduates from the program are currently working at many of the region’s hospitals, e.g., Boston Children’s, Brigham and Women’s, Mass General and North Shore Medical Center. The third cohort of 20 students is progressing through the program with expected graduation in August 2009. The college is currently receiving admissions applications for a fourth cohort of 24 students, which we expect will begin the program in May 2009. Admission to the program has always been competitive and the number of applications has increased annually. Finally, the college is developing a new track within the DEP for Nurse Practitioners in Women’s Health. The projected start date for this track is Summer 2010.
Collaborations
- Salem State provided the professional development component for Revere's Garfield Middle School "Expanded Learning Time" grant. This collaboration included a series of four year-long workshops on supporting English language learners; understanding children's mental health; motivating uninvolved students, both advanced and 'at risk,' with creative/critical activities; and improving content-area reading skills. Additionally, there were research presentations for Garfield teachers by the Salem State School of Arts & Sciences faculty in middle school content, fields such as English, math, science and social studies. This project was developed and implemented through the Salem State School of Education's Center for Education & Community.
- In an effort to increase community involvement, as well as provide hands-on business experience for students, the Bertolon School of Business "adopted" the Danvers Historical Society (DHS) for the entire academic year. The choice of this not-for-profit organization was made in conjunction with the Essex National Heritage Area. The intended outcomes of this civic engagement collaboration were to provide direct assistance to our partner organization; to emphasize the necessity for service - i.e. "giving back" - to the future business leaders we are educating; to provide expanded opportunities for hands-on learning for our students; and to create new opportunities for alumni, students and faculty to connect and network. The collaboration began with a service day in October for faculty, students and alumni, and continues with a number of service learning projects in such areas as hospitality management, data base management, and marketing. Faculty members in Business Policy are also conducting a mission and vision retreat for the DHS Board. The partnership will conclude with another service day in late Spring 2009.
- Salem State College took the lead to create the North Shore Alliance for Economic Development to serve as a regional catalyst to address economic issues on the North Shore. The goal of the alliance is to create and implement a coherent economic development strategy for the region. This organization will be a strong voice for public and private sector initiatives to enhance business revenues and employment, and to promote the North Shore as a compelling place to live and work. The Alliance will focus on the growth sectors that are important to the regional economy and on the development of strategies to help those sectors thrive. Additionally, it will assist in establishing a culture of collaboration and partnership with other institutions to avoid duplication and enhance the business climate. To assist in this endeavor, the Salem State Geography Department is establishing a regional research center, the Center for Sustainability and Economic Development. This center will provide much needed regional business support based on research and data relevant to the economics and sustainability of the region. A coalition of the educational institutes on the North Shore, which represent a tremendous asset for the cities and towns in which they are located, will be heavily involved in this initiative. These institutions serve as the primary providers of workforce development and advanced education in the region.
- Salem State College collaborated with the Salem Public School System to implement a gifted-and-talented grant funded through the Massachusetts Department of Elementary and Secondary Education. The college also provided a graduate course with follow-up consultation for teachers in talent development/educating advanced learners. Faculty from the College's School of Education also provided project evaluation.
Section I: Access to Public Higher Education in Massachusetts
Access Indicators
Fall 2007 Enrollment
| Undergraduate Headcount |
7,607 |
| Undergraduate FTE |
6,204 |
| Graduate Headcount |
2,478 |
| Graduate FTE |
977 |
Fall Enrollment
Over the last three years, fall headcount enrollment has increased 2.3%.
Over the last three years, fall full-time equivalent (FTE) enrollment has increased 5.1%.
Annual 2007–2008 Enrollment
| Undergraduate Headcount |
9,321 |
| Undergraduate FTE |
6,561 |
| Graduate Headcount |
6,424 |
| Graduate FTE |
1,932 |
Annual Enrollment
Over the last three years, annual headcount enrollment has remained relatively stable.
Over the last three years, annual FTE enrollment has increased 3.6%.
Looking Back: Undergraduate and Graduate Fall Headcount Enrollment

Fall 2007 Minority Enrollment
18%
Minority Enrollment
Greater than the Northeast Region's minority representation of 11%.
Fall 2007 Community College Transfer Students
446
Community College Transfer Students
Over the last three years, the number of community college transfer students has increased 33.5%.
Section II: Affordability of Massachusetts Community Colleges
Affordability Indicator
2007–2008 Tuition and Fees as a Percent of Median Family Income
8%
% of Median Family Income
Below the Northeast regional average of 9.1%.
Looking Back: Tuition and Fees as a Percent of Median Family Income
|
FY2004 |
FY2005 |
FY2006 |
FY2007 |
FY2008 |
| Salem State College Tuition and Fees |
$4,988 |
$5,454 |
$5,594 |
$6,030 |
$6,270 |
| State Median Family Income |
$67,527 |
$68,701 |
$71,655 |
$74,463 |
$78,497 |
| "X" as a Percent of State Median Family Income |
| X = Salem State College Tuition and Fees |
7.4% |
7.9% |
7.8% |
8.1% |
8.0% |
| X = Massachusetts State Colleges' Average Tuition and Fees |
6.7% |
7.3% |
7.5% |
7.8% |
7.7% |
| X = Northeast Average Tuition and Fees |
|
9.2% |
9.3% |
9.3% |
9.1% |
Section III: Student Success and Academic Quality
Success and Quality Indicators
Fall 2006 Cohort First-Year Retention Rate
72.6%
Fall Cohort First-Year Persistence
Comparable to the segmental rate of 74.4%, the institutional peer retention rate of 74.1%, and the national rate of 73.6%.
Looking Back: Fall-to-Fall Retention Rate
|
Cohort |
|
Entering 2002 |
Entering 2003 |
Entering 2004 |
Entering 2005 |
Entering 2006 |
| Salem State College Rate |
72.3% |
76.3% |
75.4% |
70.9% |
72.6% |
| Peer Rate |
|
75.3% |
76.1% |
74.6% |
74.1% |
| Massachusetts State Colleges Segment Rate |
74.6% |
75.2% |
76.2% |
73.5% |
74.4% |
| National Average |
|
74.3% |
74.0% |
73.7% |
73.6% |
1999–2001 Cohort Six-Year Graduation Rate (3-Year Average)
39.0%
Six-Year Graduation Rate
Below the segmental rate of 47.3% but comparable to the institutional peer rate of 39.1%.
Looking Back: Six-Year Graduation Rate
|
Cohort |
|
|
Entering 1998
Grad. by 2004 |
Entering 1999
Grad. by 2005 |
Entering 2000
Grad. by 2006 |
Entering 2001
Grad. by 2007 |
Rolling Average Entering 1999– 2001 |
| Salem State College Rate |
42.4% |
39.9% |
39.8% |
37.3% |
39.0% |
| Peer Rate |
40.1% |
39.2% |
38.5% |
39.5% |
39.1% |
| Massachusetts State Colleges Segment Rate |
47.9% |
47.2% |
48.9% |
45.9% |
47.3% |
Total Degrees Conferred in FY2008
1,924
Degrees Conferred
Average degrees conferred per year over the last three years: 1,671
Looking Back: Degrees Conferred

2007 Pass Rate on the Massachusetts Test for Educator Licensure
100%
Number of Students Passing MTEL
240
Massachusetts Test for Educator Licensure Pass Rate
Above the Board of Higher Education's target pass rate of 80%.
Percent of New Students Who Were Special Admits in Fall 2007
6.6%
Special Admissions Students
Meets the Board of Higher Education requirement of enrolling less than 10% special admissions students per year. (See Appendix.)
Section IV: Effective and Efficient Use of Resources
Effectiveness and Efficiency Indicators
Effective Projects and Initiatives
- In association with the Division of Capital Asset Management (DCAM) retrofitted a formerly vacant space on the College's Central Campus to house approximately 20,000 gross square space for its interim library. This space will house approximately 40% of the College's collection.
- Began installation of a new dual fired, energy efficient boiler serving the College's North Campus. When operational it's anticipated this boiler will more effectively meet the challenges of rising energy costs in the future.
- Using the state's "Leading By Example" Grant, eight ultra-low bathroom fixtures were installed on a pilot basis with expected water savings of over 150,000 gallons per year.
Resource Allocation
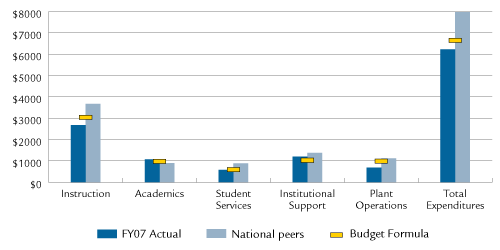
Expenditures per Student—Actual, National Peers, and Budget Formula

Note: This graphic was revised on May 6, 2009. The previously posted graphic displayed the data inaccurately.
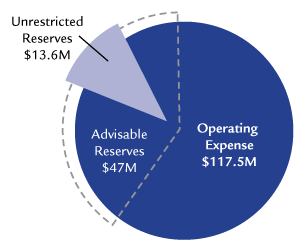
FY2008 Primary Reserve Ratio
| Unrestricted Reserves (UR) |
$13,550,882 |
| Total Operating Expenses (TOE) |
$117,529,398 |
| Primary Reserve Ratio (UR/TOE) |
11.5% |
Primary Reserve Ratio

Compliance
No materials weaknesses based on annual external independent audit:

