Policy and Report Library > Reports > 2008 Performance Measurement Report
Worcester State College
Founded in 1874, Worcester State College (WSC) is dedicated to offering high-quality, affordable undergraduate and graduate academic programs and to promoting global awareness, lifelong intellectual growth and career opportunities. The College values teaching excellence, cooperates with regional businesses, social and cultural resources, and higher education institutions, and develops new programs responsive to emerging community needs.
Program of Distinction
Collaborations
Access Indicators
Affordability Indicators
Student Success and Academic Quality Indicators
Fiscal Effectiveness and Efficiency Indicators
Program of Distinction
The Worcester State College Center for Service Learning and Civic Engagement has a mission to treat the world as our classroom and its problems as our curriculum. Not even three years-old, the Center has achieved remarkable success, earning recognition on the 2008 President’s Higher Education Community Service Honor Roll. We concentrate on three areas: building capacity for community-based learning and research; sponsoring service-learning opportunities; and enhancing community partnerships. On-campus, we offer faculty workshops, grants and fellowships. We also created a resource library and increased the number and quality of service learning courses such as: Spring Break in Nicaragua; Volunteer Tax Assistance; and Homelessness in Urban America. For the community, WSC acts as a clearinghouse for information about volunteer opportunities, and hosts annual open houses and issue-based community group presentations. We also develop community-based scholarship opportunities—most notably a Senior Fellowship for students who intern with the RFK Children’s Action Corp.
Collaborations
- WSC has one of the largest Professional Development School Partnerships in the state. Partly funded in 1995 by a Goals 2000 Grant, the partnership continues to date. The program is aimed at improving the education of prospective elementary and early childhood teachers while simultaneously providing professional development opportunities for public school personnel working at Chandler Magnet School, Chandler Magnet Elementary, Belmont Community, May Street School, Tatnuck Magnet, Columbus Park and Woodland Academy. One of the five components of the program is the designation of one student as a "Clinical Professor" from among the member schools. The Clinical Professor, considered a full-time member of the Education faculty, monitors pre-practicum experience, supervises student teachers and is involved in the student teaching seminar. Other facets of the program include pre-practicum students and student teachers assigned to PDS schools, Elementary Science Methods class taught at Chandler, student teacher presentations in all schools and classes, Professional Development Days Programs based on a model of "rounds," and a concurrent Seminar for student teachers.
- WSC is one of 50 colleges and universities from across the country selected to participate in a national assessment of first-time freshmen. The Wabash National Study of Liberal Arts Education is a large-scale, longitudinal study investigating factors that affect outcomes of a liberal arts education, with the goal of helping institutions systematically improve student learning. The first round of the survey was administered to first-year WSC freshmen in Fall 2008. The students will participate in a second round of assessments at the end of the academic year, and will participate in their senior year. The College's Office of Institutional Assessment will work with the Wabash consultants throughout the year, and the data will be used to assess a variety of the College's programs, both academic and social. The study is funded by the Teagle Foundation and the Davis Educational Foundation.
- WSC's Voluntary Income Tax Assistance (VITA) program helps community members with their taxes at no cost to the taxpayer. WSC students who sign up for the VITA course receive IRS certification, valuable volunteer experience, and an academic survey of tax policies and their effects, as well as academic credit in the Business Administration or Sociology Departments. The program brought in hundreds of community taxpayers who, with the help of WSC students, collectively received more than $400,000 in federal refunds last season. The course is sponsored by The Center for Service Learning and Civic Engagement at WSC, the Business Administration Department at WSC, the IRS and United Way.
- With the help of a grant from the Fairlawn Foundation, WSC conducted workshops for area nurses interested in a career in nursing education. The workshop included active-learning clinical teaching, clinical assessments and the legal and ethical issues involved in teaching. The grant money will also be used to provide scholarship aid to nurses pursuing doctorate degrees in health care or education, as well as faculty stipends for professional development. In October, WSC dedicated its Fairlawn Foundation Clinical Skills Nursing Laboratory at the Ghosh Science Center on the WSC campus. The fully equipped lab features IV pumps, electronic thermometers, blood pressure units and sophisticated "sim" manikins that permit student nurses to try out their skills and develop competence and confidence in a low-stress classroom setting.
Section I: Access to Public Higher Education in Massachusetts
Access Indicators
Fall 2007 Enrollment
| Undergraduate Headcount |
4,602 |
| Undergraduate FTE |
3,645 |
| Graduate Headcount |
756 |
| Graduate FTE |
293 |
Fall Enrollment
Over the last three years, fall headcount enrollment has decreased 2.1%.
Over the last three years, fall full-time equivalent (FTE) enrollment has remained relatively stable.
Annual 2007–2008 Enrollment
| Undergraduate Headcount |
6,262 |
| Undergraduate FTE |
3,961 |
| Graduate Headcount |
2,878 |
| Graduate FTE |
636 |
Annual Enrollment
Over the last three years, annual headcount enrollment has remained relatively stable.
Over the last three years, annual FTE enrollment has increased 2.9%.
Looking Back: Undergraduate and Graduate Fall Headcount Enrollment

Fall 2007 Minority Enrollment
14.3%
Minority Enrollment
Greater than the Central Region's minority representation of 9.0%.
Fall 2007 Community College Transfer Students
256
Community College Transfer Students
Over the last three years, the number of community college transfer students has increased 26.7%.
Section II: Affordability of Massachusetts Community Colleges
Affordability Indicator
2007–2008 Tuition and Fees as a Percent of Median Family Income
7.5%
% of Median Family Income
Below the Northeast regional average of 9.1%.
Looking Back: Tuition and Fees as a Percent of Median Family Income
|
FY2004 |
FY2005 |
FY2006 |
FY2007 |
FY2008 |
| Worcester State College Tuition and Fees |
$4,123 |
$4,579 |
$5,080 |
$5,540 |
$5,866 |
| State Median Family Income |
$67,527 |
$68,701 |
$71,655 |
$74,463 |
$78,497 |
| "X" as a Percent of State Median Family Income |
| X = Worcester State College Tuition and Fees |
6.1% |
6.7% |
7.1% |
7.4% |
7.5% |
| X = Massachusetts State Colleges' Average Tuition and Fees |
6.7% |
7.3% |
7.5% |
7.8% |
7.7% |
| X = Northeast Average Tuition and Fees |
|
9.2% |
9.3% |
9.3% |
9.1% |
Section III: Student Success and Academic Quality
Success and Quality Indicators
Fall 2006 Cohort First-Year Retention Rate
76.0%
Fall Cohort First-Year Persistence
Comparable to the segmental rate of 74.4% and above the institutional peer retention rate of 71.6% and the national rate of 73.6%.
Looking Back: Fall-to-Fall Retention Rate
|
Cohort |
|
Entering 2002 |
Entering 2003 |
Entering 2004 |
Entering 2005 |
Entering 2006 |
| Worcester State College Rate |
72.7% |
71.1% |
75.1% |
73.8% |
76.0% |
| Peer Rate |
|
71.0% |
73.23% |
70.9% |
71.6% |
| Massachusetts State Colleges Segment Rate |
74.6% |
75.2% |
76.2% |
73.5% |
74.4% |
| National Average |
|
74.3% |
74.0% |
73.7% |
73.6% |
1999–2001 Cohort Six-Year Graduation Rate (3-Year Average)
40.1%
Six-Year Graduation Rate
Below the segmental rate of 47.3% but above the institutional peer rate of 35.7%.
Looking Back: Six-Year Graduation Rate
|
Cohort |
|
|
Entering 1998
Grad. by 2004 |
Entering 1999
Grad. by 2005 |
Entering 2000
Grad. by 2006 |
Entering 2001
Grad. by 2007 |
Rolling Average Entering 1999– 2001 |
| Worcester State College Rate |
43.2% |
43.5% |
36.9% |
39.9% |
40.1% |
| Peer Rate |
33.5% |
35.9% |
34.9% |
36.4% |
35.7% |
| Massachusetts State Colleges Segment Rate |
47.6% |
47.2% |
48.9% |
45.9% |
47.3% |
Total Degrees Conferred in FY2008
1,076
Degrees Conferred
Average degrees conferred per year over the last three years: 1,067
Looking Back: Degrees Conferred

2007 Pass Rate on the Massachusetts Test for Educator Licensure
100%
Number of Students Passing MTEL
95
Massachusetts Test for Educator Licensure Pass Rate
Above the Board of Higher Education's target pass rate of 80%.
Percent of New Students Who Were Special Admits in Fall 2007
6.4%
Special Admissions Students
Meets the Board of Higher Education requirement of enrolling less than 10% special admissions students per year. (See Appendix.)
Section IV: Effective and Efficient Use of Resources
Effectiveness and Efficiency Indicators
Effective Projects and Initiatives
- In collaboration with Chartwell's Dining services the college has instituted energy efficient and waste reduction procedures in its food service venues. Food waste has been reduced by 23,565 pounds by eliminating serving trays; 168,000 gallons of water has been saved by installing low flow spray valves for pre-rinsing dishes and by the elimination of serving trays. The anticipated annual cost savings is $11,500.
- Partnered with members of the Colleges of the Worcester Consortium (COWC) to procure shared internal audit services at a discount rate (two thirds the cost of procuring this service independently).
- Raised $1,423,282 through private fundraising, a 26% increase over the prior year.
- Worcester State Foundation provided just over $1,004,000 in support to the college for its programs and students, a 19% increase over the prior year
Resource Allocation
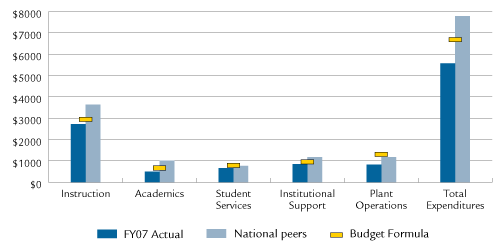
Expenditures per Student—Actual, National Peers, and Budget Formula

Note: This graphic was revised on May 6, 2009. The previously posted graphic displayed the data inaccurately.
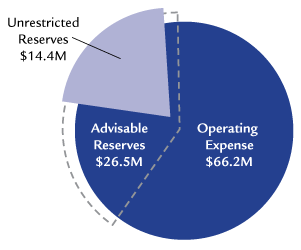
FY2008 Primary Reserve Ratio
| Unrestricted Reserves (UR) |
$14,388,882 |
| Total Operating Expenses (TOE) |
$66,160,705 |
| Primary Reserve Ratio (UR/TOE) |
21.7% |
Primary Reserve Ratio

Compliance
No materials weaknesses based on annual external independent audit:

