

Massachusetts compared with 60% by 2010-2020 Goal
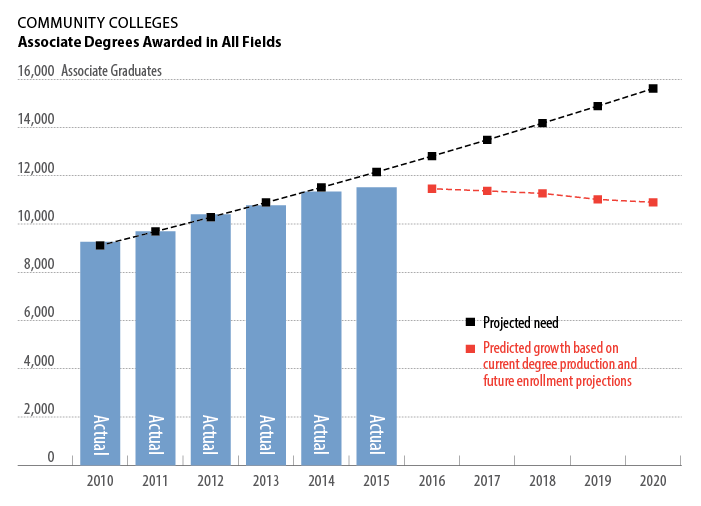
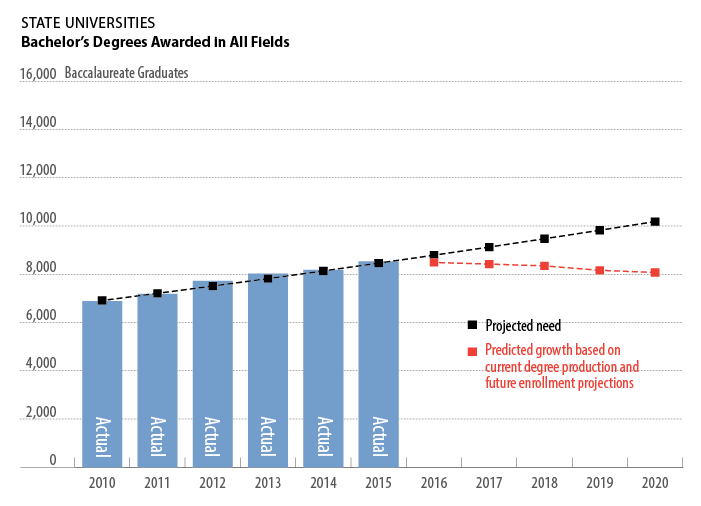
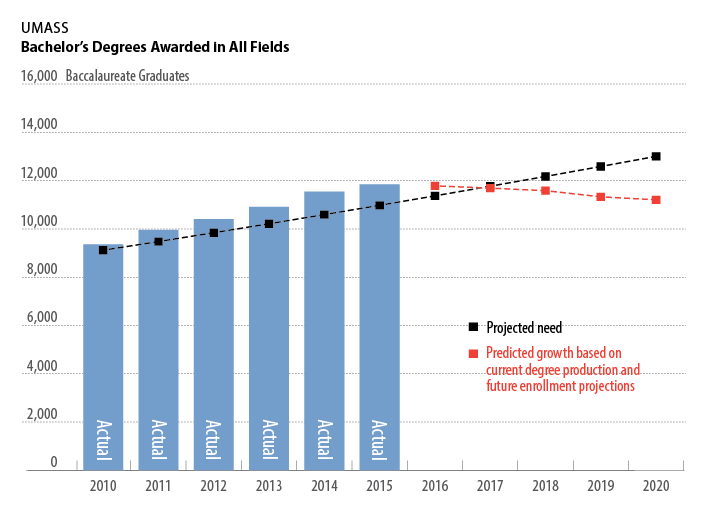
These projections began with calculations of the number of college graduates that Massachusetts would need each year, beginning in 2010, to meet the goal of 60% of residents holding a college degree by 2020.
To better align this goal with Massachusetts’ specific workforce needs, this total number of graduates was broken out by degree type—associate’s, bachelor’s, and graduate— using projections from Georgetown’s Center for Education and the Workforce.
Because this report focuses on Massachusetts’ public campuses, degree totals were then broken out by public and private share using the current split in Massachusetts for each degree type. Only the public share is shown here; the charts do not show the projected need for or growth in private college graduates.
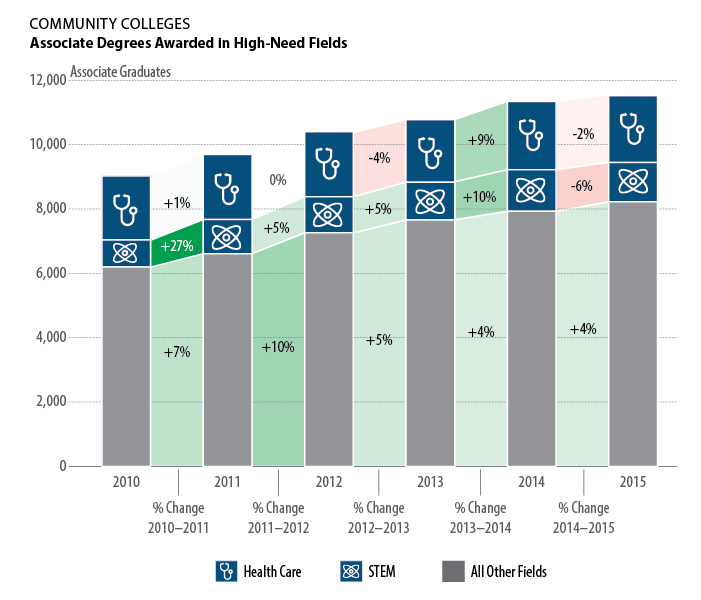
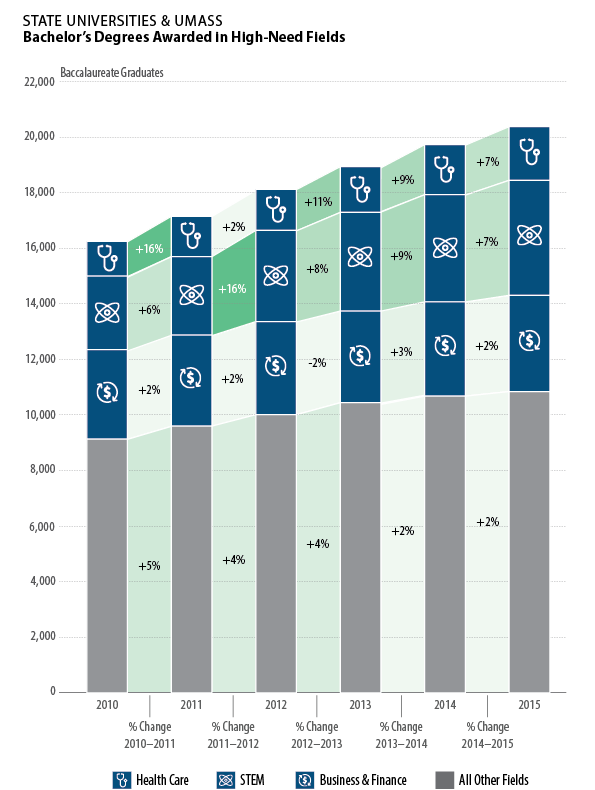
High-Need Fields: While graduates of Massachusetts’ public campuses are employed in a wide range of fields, the three fields included in this metric—Health Care; STEM (Science, Technology, Engineering & Mathematics); and Business & Finance—show both a high level of projected growth and a high number of future vacancies. For example, Health Care, STEM and Business & Finance represent 38 percent of jobs in 2020 projected to require a bachelor degree.
Graph Components: The blue sections of the stacked bar graphs show the number of degrees awarded in each high-need field in the given year; the gray sections show the remaining number of degrees awarded in other fields that year. The spaces between each stacked bar show the annual percent change in degrees awarded in each category, both numerically and with a heat map representation. Shades of green indicate growth, with deeper shades of green indicating stronger growth. Shades of red indicate decline, with deeper shades of red indicating sharper declines.
Honing In On College Access, Affordability and Completion in Massachusetts

Email the Webmaster | Privacy Policy | Terms of Use | Accessibility Statement
Massachusetts Department of Higher Education. All Rights Reserved. ©2000-2026
One Ashburton Place, Room 1401, Boston, MA 02108 | Directions
(617) 994-6950 | General Email Form | Public Records Requests
![]()
![]()
![]()
![]()
![]()
![]()