Policy and Report Library > Reports > 2008 Performance Measurement Report
Springfield Technical Community College
Springfield Technical Community College (STCC) has a strong and recognized commitment to the economic development of the Pioneer Valley, Massachusetts, and the nation. The College is a leader in technology education and instructional innovation offering degree and certificate programs in technologies, health sciences, business, and engineering.
Program of Distinction
Collaborations
Access Indicators
Affordability Indicators
Student Success and Academic Quality Indicators
Fiscal Effectiveness and Efficiency Indicators
Program of Distinction
Springfield Technical Community College has a long standing collaboration with the Hampden County House of Correction (HCHC). The School of Continuing Education (SCE) offers five to seven college-level credit courses each year at the prison. In FY2008, 123 incarcerated students attended college courses while at HCHC. In many cases, this program is the student's first encounter with higher education. SCE offers many preliminary services to these potential college students, including GED testing at the prison and assistance with required paperwork, including the FAFSA, and admission and registration forms. One-hundred seventeen HCHC inmates received their GED in FY2008.
To follow up and build upon the relationship started with the student while at the prison, SCE works with the HCHC Pre-Release Center. HCHC supplies a staff member who coordinates with the SCE office, as well as Offices of Financial Aid and Admissions, to place ex-offenders in college when they are released. Last year, 149 ex-offenders took advantage of these services and enrolled in college courses at STCC.
Collaborations
- STCC Teacher Education Transfer Department has continued to serve paraprofessionals in the Springfield K-12 public schools in several collaborative ways. STCC institutionalized the UPDATE program under the School of Liberal Arts Transfer and General Studies after funding from BHE Improving Teacher Quality Grant funds ended. The School has collaborated, on behalf of enrolled paraprofessionals, with the Office for Student Financial Aid relative to the Paraprofessional Teacher Preparation Grant for the awarding of the work-based financial aid. Also, academic advising includes collaborating with local four year college administrators for the students' smooth transition to local 4 year college education departments. For many years collaboration with the Springfield Public Schools Professional Development Specialist has resulted in STCC offering one free college level course to paraprofessionals each year. Each course has serviced 25 to 30 students, most of who are interested, if not already pursuing, the teacher transfer degree.
- STCC provides collaborative services to the community as a Bio-Teach Regional Training Center, serving Western Massachusetts and the Berkshires as a biotechnology training resource for secondary school educators. Bio-Teach is an educational program sponsored by the Mass Biotech council, and has the mission of providing training and equipment to develop the capacity to include biotechnology in every public school curriculum. As the designated Regional Training Center, STCC provides professional development for biology teachers and assisting them to access and use engaging biotech curricula. STCC has hosted multiple professional development workshops for high school educators, and provides ongoing support and refresher training opportunities for participating teachers.
- The University of Massachusetts Amherst is leading a Commonwealth Alliance for Information Technology Education (CAITE) to design and carry out comprehensive programs that address under representation in information technology (IT) education and the workforce. CAITE will focus on women and minorities in groups that are underrepresented in the Massachusetts innovation economy.. The project will pilot a series of outreach programs supported by educational pathways in three regions (one rural, one suburban, and one urban). The project will include work with high school teachers, staff, and counselors. CAITE will identify best practices and disseminate, deploy, extend and institutionalize these best practices statewide and nationally. Community colleges, such as STCC, are the centerpiece of CAITE and an integral partner in the collaboration because of the central role they play in reaching out to underserved populations and in serving as a gateway to careers and further higher education. This project will build a broad alliance built on its leadership in and partnership with the Commonwealth Information Technology Initiative (CITI), the Boston Area Advanced Technological Education Center (BATEC), regional Louis Stokes Alliances and NSF EGEP programs, and other partnerships and initiatives focused on information technology education and STEM pipeline issues.
- STCC's partnership with MassMutual Financial Group will be administered through the College's Division of Economic and Business Development via the Center for Business and Technology. This collaboration is a credit-free approach to supporting workforce development. Specifically, the training program has been designed to increase both the size of the talent pool and the success rate of those individuals selected to take part in MassMutual's Call Center Representative Training Program. STCC will provide pre-training in the following area for up to 12 individuals: Investment Basics, Work Readiness Skills, Problem Solving, Customer Service Excellence, Computer Application Skills and Test-Taking Strategies/Mentoring. This collaborative initiative serves as a pilot project with funding from MassMutual totaling $25,000. The results of this pre-training program will serve as a benchmark for further credit-free workforce development initiatives between STCC and MassMutual.
Section I: Access to Public Higher Education in Massachusetts
Access Indicators
Fall 2007 Enrollment
| Headcount |
6,074 |
| FTE |
3,805 |
Fall Enrollment
Over the last three years, fall headcount enrollment has increased 4.3%.
Over the last three years, fall full-time equivalent (FTE) enrollment has remained relatively stable.
Annual 2007–2008 Enrollment
| Headcount |
8,506 |
| FTE |
3,978 |
Annual Enrollment
Over the last three years, annual headcount enrollment has increased 3.2%.
Over the last three years, annual FTE enrollment has remained relatively stable.
Looking Back: Fall and Annual Headcount Enrollment

Fall 2007 Minority Enrollment
36.1%
Minority Enrollment
Greater than the minority representation of the institution's primary draw cities and towns (23.9%) and the Greater Boston Region's minority representation of 16.3%.
Section II: Affordability of Massachusetts Community Colleges
Affordability Indicator
2007–2008 Tuition and Fees as a Percent of Median Family Income
4.6%
% of Median Family Income
Comparable to the Northeast regional average of 4.9%.
Looking Back: Tuition and Fees as a Percent of Median Family Income
|
FY2004 |
FY2005 |
FY2006 |
FY2007 |
FY2008 |
| Springfield Technical Community College Tuition and Fees |
$3,144 |
$3,204 |
$3,354 |
$3,456 |
$3,576 |
| State Median Family Income |
$67,527 |
$68,701 |
$71,655 |
$74,463 |
$78,497 |
| "X" as a Percent of State Median Family Income |
| X = Springfield Technical Community College Tuition and Fees |
4.7% |
4.7% |
4.7% |
4.6% |
4.6% |
| X = Massachusetts Community Colleges' Average Tuition and Fees |
4.8% |
4.9% |
4.9% |
4.7% |
4.7% |
| X = Northeast Average Tuition and Fees |
|
4.8% |
4.8% |
4.9% |
4.9% |
Section III: Student Success and Academic Quality
Success and Quality Indicators
Fall 2006 Cohort First-Year Persistence Rate
| Retained at original institution |
57.0% |
| Retained at any institution |
63.1% |
Fall Cohort First-Year Persistence
Persistence at original institution has remained stable over the last three years and is comparable to the segmental average of 56.5%.
Looking Back: Fall-to-Fall First-Year Persistence Rate

Fall 2003 Cohort Four-Year Overall Success Rate
75.7%
Fall 2003 Cohort Four-Year Individual Success Rates
| Earned Degree/Certificate |
40.5% |
| Transferred |
12.9% |
| Earned 30 Credits |
21.2% |
| Still Enrolled |
1.1% |
| Note: Each subsequent category excludes any student included in previous category(ies) |
Fall Cohort Four-Year Overall Success Rate
This new indicator measures students who have earned a degree/certificate, transferred to another institution, earned 30 or more credits, or are still enrolled after four years. Future reports will include these outcomes over four, five, and six years for this and successive cohorts. Please see the Technical Guide for further details regarding this indicator.
2007–2008 Fall-to-Spring Retention Rate
90%
Fall-to-Spring Retention Rate
Fall-to-spring retention has remained stable over the last three years.
FY2008 Credit Course Completion Rate
80.1%
Course Completion
Above the Board of Higher Education's target rate of 75%.
Total Degrees Conferred in FY2008
841
Degrees Conferred
Average degrees conferred per year over the last three years: 848
Looking Back: Degrees Conferred

2007 Pass Rate on the National Nursing Licensure Examination
91.7%
Nursing Exam Pass Rate
Above the Board of Higher Education's target pass rate of 85%.
FY2008 Annual Enrollment in Workforce Development Courses
2,731
Workforce Development
Average annual enrollment in workforce development courses per year over the last three years: 3,227
Section IV: Effective and Efficient Use of Resources
Effectiveness and Efficiency Indicators
Effective Projects and Initiatives
- The College completed a $4 million major gift campaign for equipment and scholarships.
- The College negotiated a new contract for gas and completed a study for biomass plant, reducing energy costs.
- The College replaced one cooling tower, resulting in efficiencies in cooling.
Resource Allocation
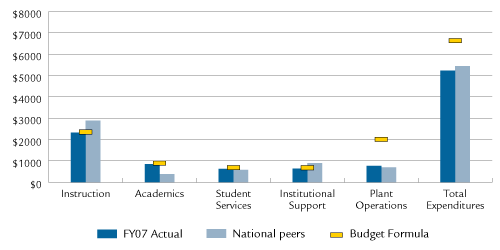
Expenditures per Student—Actual, National Peers, and Budget Formula

Note: This graphic was revised on May 6, 2009. The previously posted graphic displayed the data inaccurately.
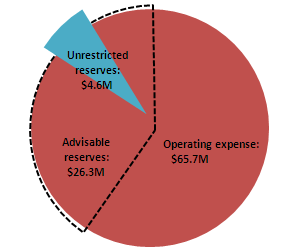
FY2008 Primary Reserve Ratio
| Unrestricted Reserves (UR) |
$4,647,515 |
| Total Operating Expenses (TOE) |
$65,758,860 |
| Primary Reserve Ratio (UR/TOE) |
7.1% |
Primary Reserve Ratio

Compliance
No materials weaknesses based on annual external independent audit:

