Berkshire Community College
Berkshire Community College (BCC) is committed to access, academic excellence, student success, and leadership in the community. As the College was founded to serve the needs of Berkshire County, its mission is to place higher education within reach of all Berkshire County residents.
Program of Distinction
Collaborations
Access Indicators
Affordability Indicators
Student Success and Academic Quality Indicators
Fiscal Effectiveness and Efficiency Indicators
Program of Distinction
Located in downtown Pittsfield, the Intermodal Education Center represents a unique collaboration between BCC and Massachusetts College of Liberal Arts to provide quality postsecondary education to the region. The partnership provides access to associate's, bachelor's, and master's degree programs offered by the two partnering institutions. The Intermodal Center also houses administrative offices for the Advanced Manufacturing Training Program (supported by a WCTF grant), as well as a Business and Industry Training Center that offers a wide range of specialized workforce development programs. Since its opening in January 2008, the Center has served more than 1,000 individuals, and BCC plans to utilize additional space in the facility to accommodate the growing number of interested students.
In addition to the primary focus on education and training, the Center has become an important part of the economic revival of downtown Pittsfield and offers a convenient venue for conducting community-based academic and business related events. The Berkshire Compact for Higher Education articulated as a goal the vital need for an education facility in downtown Pittsfield in order to improve access, particularly for students who rely heavily on the use of public transportation. The Intermodal Education Center is enthusiastically supported by the local business community, the mayors of Pittsfield and North Adams, the Berkshire Legislative Delegation, and Congressman John Olver.
Collaborations
- BCC administered the Accuplacer Skills Assessment test in reading, writing and mathematics to the entire 11th grade class in each of Pittsfield’s three high schools, and in eighty percent (80%) of all high schools county-wide. Offering Accuplacer to high school juniors constitutes an important effort to help students assess their preparedness for college-level work and focus more effectively during their senior year on their academic strengths and weaknesses. During the 2007-2008 academic year, 881 juniors received the benefit of testing services coordinated through the College’s Office of Assessment and Testing and the Berkshire TechPrep Consortium.
- In 2008, BCC was awarded a Workforce Competitiveness Trust Fund grant in order to establish an Applied Manufacturing Technology Training Institute (AMTTI). The overall purpose of the AMTTI project is to address the short- and long-term workforce development needs of the region’s manufacturing industries and related production occupations by strengthening career and educational pathways for incumbent, unemployed, dislocated and older workers (50+) and high school students. Project activities include: 1) a series of college courses leading to a Certificate in Applied Manufacturing Technology; 2) a skills training component for incumbent workers focused on leadership, management and applied manufacturing skills; and 3) a summer program for high school students to strengthen math skills, applied manufacturing and workplace leadership skills. Through this program, incumbent workers will be able to upgrade their skills to improve job retention and career mobility options and high school students will be exposed to the wide array of jobs available in manufacturing occupations. AMTTI’s training program has been so well received that more than fifty people applied for the grant’s limit of twenty available openings in its incumbent worker component.
- Berkshire, Greenfield, and Mount Wachusett Community Colleges, together with regional healthcare providers, developed and were awarded a federal grant for a Northern Tier Healthcare Training and Education Initiative. This initiative will establish three regional simulation nursing laboratories that will expand the capacity of each partner to provide clinical training for an increased number of students enrolling in nursing programs. The collaboration’s overall objective is to address the region’s current shortage of trained healthcare professionals.
- This past year, BCC offered “Form and Function: Discovering Strength and Beauty in Nature” for the second installment of an innovative summer program Empowering Women for Success. Designed primarily for young women, the objectives of the program are to demonstrate how math and science are an integral part of everyday life, and to foster a greater understanding among women of the numerous careers in these fields. Conducted by professional women in the fields of biology, engineering, math, health sciences and fine arts, the week-long workshop was designed to not only strengthen academic success in math and science through applied learning and interactive field experiences, but also to promote wellness, self-awareness and confidence through an exploration of the mind-body connection. The program utilized the main campus of BCC and grounds of Canyon Ranch as natural laboratories for support of investigations and experiential learning. Twenty-four high school students completed the program last summer.
Section I: Access to Public Higher Education in Massachusetts
Access Indicators
Fall 2007 Enrollment
| Headcount |
2,267 |
| FTE |
1,343 |
Fall Enrollment
Over the last three years, fall headcount enrollment has decreased 2.6%.
Over the last three years, fall full-time equivalent (FTE) enrollment has remained relatively stable.
Annual 2007–2008 Enrollment
| Headcount |
3,000 |
| FTE |
1,364 |
Annual Enrollment
Over the last three years, annual headcount enrollment has decreased 3.7%.
Over the last three years, annual FTE enrollment has remained relatively stable.
Looking Back: Fall and Annual Headcount Enrollment

Fall 2007 Minority Enrollment
10.8%
Minority Enrollment
Greater than the minority representation of the institution's primary draw cities and towns (5.1%) and the Berkshire Region's minority representation of 5.0%.
Section II: Affordability of Massachusetts Community Colleges
Affordability Indicator
2007–2008 Tuition and Fees as a Percent of Median Family Income
4.9%
% of Median Family Income
Comparable to the Northeast regional average of 4.9%.
Looking Back: Tuition and Fees as a Percent of Median Family Income
|
FY2004 |
FY2005 |
FY2006 |
FY2007 |
FY2008 |
| Berkshire Community College Tuition and Fees |
$3,390 |
$3,390 |
$3,600 |
$3,675 |
$3,826 |
| State Median Family Income |
$67,527 |
$68,701 |
$71,655 |
$74,463 |
$78,497 |
| "X" as a Percent of State Median Family Income |
| X = Berkshire Community College Tuition and Fees |
5.0% |
4.9% |
5.0% |
4.9% |
4.9% |
| X = Massachusetts Community Colleges' Average Tuition and Fees |
4.8% |
4.9% |
4.9% |
4.7% |
4.7% |
| X = Northeast Average Tuition and Fees |
|
4.8% |
4.8% |
4.9% |
4.9% |
Section III: Student Success and Academic Quality
Success and Quality Indicators
Fall 2006 Cohort First-Year Persistence Rate
| Retained at original institution |
55.5% |
| Retained at any institution |
66.9% |
Fall Cohort First-Year Persistence
Persistence at original institution has declined 4 percentage points over the last three years and is comparable to the segmental average of 56.5%.
Looking Back: Fall-to-Fall First-Year Persistence Rate

Fall 2003 Cohort Four-Year Overall Success Rate
77.8%
Fall 2003 Cohort Four-Year Individual Success Rates
| Earned Degree/Certificate |
48.3% |
| Transferred |
9.9% |
| Earned 30 Credits |
17.9% |
| Still Enrolled |
1.6% |
| Note: Each subsequent category excludes any student included in previous category(ies) |
Fall Cohort Four-Year Overall Success Rate
This new indicator measures students who have earned a degree/certificate, transferred to another institution, earned 30 or more credits, or are still enrolled after four years. Future reports will include these outcomes over four, five, and six years for this and successive cohorts. Please see the Technical Guide for further details regarding this indicator.
2007–2008 Fall-to-Spring Retention Rate
92.8%
Fall-to-Spring Retention Rate
Fall-to-spring retention has remained relatively stable over the last three years.
FY2008 Credit Course Completion Rate
75.2%
Course Completion
Comparable to the Board of Higher Education's target rate of 75%.
Total Degrees Conferred in FY2008
302
Degrees Conferred
Average degrees conferred per year over the last three years: 307
Looking Back: Degrees Conferred

2007 Pass Rate on the National Nursing Licensure Examination
86.3%
Nursing Exam Pass Rate
Above the Board of Higher Education's target pass rate of 85%.
FY2008 Annual Enrollment in Workforce Development Courses
1,802
Workforce Development
Average annual enrollment in workforce development courses per year over the last three years: 1,569
Section IV: Effective and Efficient Use of Resources
Effectiveness and Efficiency Indicators
Effective Projects and Initiatives
- Received a bequest of $506,241 with $250,000 forming the corpus of an endowed scholarship; the balance was used to update laboratories in the Nursing and Allied Health Program.
- Secured a Workforce Competitiveness Grant administered by the Commonwealth Corporation for $489,158 to focus on workforce development in manufacturing.
- Established a higher education center in Pittsfield's new downtown Intermodal Center. Partnered with Massachusetts College of Liberal Arts to meet the educational needs of the county in a shared, central location.
Resource Allocation
Expenditures per Student—Actual, National Peers, and Budget Formula
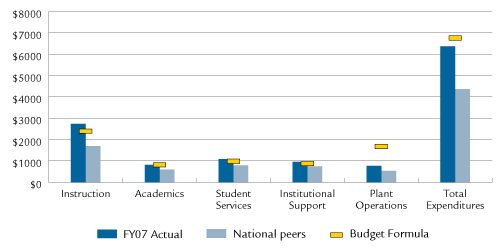
Note: This graphic was revised on May 6, 2009. The previously posted graphic displayed the data inaccurately.
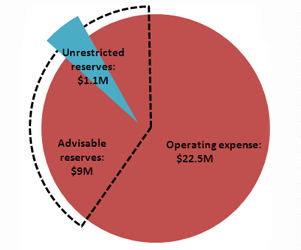
FY2008 Primary Reserve Ratio
| Unrestricted Reserves (UR) |
$1,168,458 |
| Total Operating Expenses (TOE) |
$22,528,854 |
| Primary Reserve Ratio (UR/TOE) |
5.2% |
Primary Reserve Ratio
Compliance
No materials weaknesses based on annual external independent audit:

