Roxbury Community College
Roxbury Community College (RCC) is a comprehensive, urban, student-centered, open-access community college providing higher learning opportunities for all who may benefit. The primary mission of the College is to serve the needs of the diverse greater Roxbury area and surrounding Boston metropolitan communities, offering higher education learning opportunities in developmental academic skills, the liberal arts and sciences, career and transfer programs, workforce development, and private and public sector training.
Program of Distinction
Collaborations
Access Indicators
Affordability Indicators
Student Success and Academic Quality Indicators
Fiscal Effectiveness and Efficiency Indicators
Program of Distinction
The Summer Academic Enrichment Program (SAEP) was designed to provide access to educational opportunities and facilitate success for Roxbury Community College (RCC) students planning to attend Northeastern University (NU) or other four-year higher education institutions to attain bachelor's degrees. SAEP was established as part of an educational partnership agreement between RCC and NU. The components of the agreement include joint training initiatives, technical and managerial consultation, resource sharing, collaborative fundraising and enhanced financial aid packages. Program participants must successfully complete one academic year at RCC, be full-time students who intend to pursue a four-year education, and have a GPA of 2.75 or higher at the time of application.
Since its inception in 1999, the number of participants has doubled from 10 to 20 students. Seventy-five percent of these students completed the associate's degree, 69% of participants continued their education at four-year institutions, and 38% attended NU. Each year, four students who successfully complete the program, graduate from RCC, and meet admission requirements are selected to receive a $10,000 scholarship from NU, renewable for three consecutive years. Of the 26 students who received awards, 22 have completed or will complete their bachelor's degrees by 2010.
Collaborations
- RCC is working with the Massachusetts Space Grant Consortium to recruit students to STEM programs, retain students currently in STEM programs, and increase interest in STEM fields. The STEM Speaker Series also exposes current and prospective students to STEM research, career opportunities, internships, and programs at RCC, and fosters collaborations with professionals in industry and at institutes.
- RCC has established the Math and Science Advancement: Pathways to College and Employment program. The program works closely with the Boston Private Industry Council (PIC), career centers and neighborhood health clinics to identify 35 Boston residents each year who are interested in health careers but are not academically prepared for college. Students take a series of math, science and English classes to prepare them for careers in health care, particularly in nursing, surgical technology, radiology and respiratory therapy. Students who complete this program are encouraged to apply to related programs at RCC. This program is supported by the Economic Development Industrial Corporation/Office of Jobs and Community Services (EDIC/JCS).
- RCC is collaborating with the Boston Public Library and the Dudley Literacy Center, with support from the Fellowes Athenaeum Trust Fund, to help more adults in the community complete their GED and ultimately attend RCC. The collaboration provides a variety of services, including exposure to available resources at the library and Literacy Center, awareness of career opportunities for diploma recipients, and extensive tutoring, counseling, and instruction.
- RCC works closely with the Boston Public Schools to introduce students to great theatre. The Roxbury Repertory Theatre at RCC focuses on works that can be integrated with the English curriculum at area high schools. Each year, more than 1,000 BPS students read plays that were performed at Roxbury Community College. After each performance, students had question and answer sessions with the director and actors about the play, and the performers' interpretation of the writer's works. The most recent productions have been The Crucible and The Miracle Worker.
- RCC, Boston Medical Center, Action for Boston Community Development, Boston Public Schools, Greater Roslindale Medical and Dental Health Center, Mattapan Community Health Center and Whittier Health Center are Collaborating on the Access and Retention In Skilled Employment Project (ARISE), which provides participants with career exploration assistance, individual and group career counseling, academic advising and mentoring, two certificate degree program options, field experience, and job placement assistance. The primary goal of the program is to educate, train, mentor and counsel nontraditional, underrepresented Boston residents for employment and further education in a specific sector of the high-growth health care industry for which appropriate training resources have not yet been created. A secondary goal of ARISE is to improve access and equity in health care by increasing the representation of skilled health service professionals who understand the languages, cultures, communication styles and values of populations that have experienced disparities in healthcare access and outcomes. Students will require no longer than two years to obtain a certificate in the 25-credit Medical Office Specialist program or in the 31-credit Medical Office Administration Specialist program. These college credits create a clear pathway to a variety of professions, including those currently in demand in the healthcare industry in greater Boston.
Section I: Access to Public Higher Education in Massachusetts
Access Indicators
Fall 2007 Enrollment
| Headcount |
2,398 |
| FTE |
1,464 |
Fall Enrollment
Over the last three years, fall headcount enrollment has increased 7.2%.
Over the last three years, fall full-time equivalent (FTE) enrollment has increased 6.5%.
Annual 2007–2008 Enrollment
| Headcount |
3,488 |
| FTE |
1,513 |
Annual Enrollment
Over the last three years, annual headcount enrollment has increased 3.2%.
Over the last three years, annual FTE enrollment has remained relatively stable.
Looking Back: Fall and Annual Headcount Enrollment

Fall 2007 Minority Enrollment
93%
Minority Enrollment
Greater than the minority representation of the institution's primary draw cities and towns (42.7%) and the Greater Boston Region's minority representation of 21.0%.
Section II: Affordability of Massachusetts Community Colleges
Affordability Indicator
2007–2008 Tuition and Fees as a Percent of Median Family Income
4.7%
% of Median Family Income
Comparable to the Northeast regional average of 4.9%.
Looking Back: Tuition and Fees as a Percent of Median Family Income
|
FY2004 |
FY2005 |
FY2006 |
FY2007 |
FY2008 |
| Roxbury Community College Tuition and Fees |
$3,250 |
$3,460 |
$3,460 |
$3,460 |
$3,660 |
| State Median Family Income |
$67,527 |
$68,701 |
$71,655 |
$74,463 |
$78,497 |
| "X" as a Percent of State Median Family Income |
| X = Roxbury Community College Tuition and Fees |
4.8% |
5.0% |
4.8% |
4.6% |
4.7% |
| X = Massachusetts Community Colleges' Average Tuition and Fees |
4.8% |
4.9% |
4.9% |
4.7% |
4.7% |
| X = Northeast Average Tuition and Fees |
|
4.8% |
4.8% |
4.9% |
4.9% |
Section III: Student Success and Academic Quality
Success and Quality Indicators
Fall 2006 Cohort First-Year Persistence Rate
| Retained at original institution |
53.4% |
| Retained at any institution |
62.6% |
Fall Cohort First-Year Persistence
Persistence at original institution has increased 9.4 percentage points over the last three years but is below to the segmental average of 56.5%.
Looking Back: Fall-to-Fall First-Year Persistence Rate

Fall 2003 Cohort Four-Year Overall Success Rate
68.5%
Fall 2003 Cohort Four-Year Individual Success Rates
| Earned Degree/Certificate |
23.6% |
| Transferred |
21% |
| Earned 30 Credits |
21.6% |
| Still Enrolled |
2.3% |
| Note: Each subsequent category excludes any student included in previous category(ies) |
Fall Cohort Four-Year Overall Success Rate
This new indicator measures students who have earned a degree/certificate, transferred to another institution, earned 30 or more credits, or are still enrolled after four years. Future reports will include these outcomes over four, five, and six years for this and successive cohorts. Please see the Technical Guide for further details regarding this indicator.
2007–2008 Fall-to-Spring Retention Rate
78.4%
Fall-to-Spring Retention Rate
Fall-to-spring retention has declined 6.6 percentage points over the last three years.
FY2008 Credit Course Completion Rate
78.1%
Course Completion
Above the Board of Higher Education's target rate of 75%.
Total Degrees Conferred in FY2008
180
Degrees Conferred
Average degrees conferred per year over the last three years: 190
Looking Back: Degrees Conferred

2007 Pass Rate on the National Nursing Licensure Examination
66.7%
Nursing Exam Pass Rate
Below the Board of Higher Education's target pass rate of 85%.
FY2008 Annual Enrollment in Workforce Development Courses
1,348
Workforce Development
Average annual enrollment in workforce development courses per year over the last three years: 1,293
Section IV: Effective and Efficient Use of Resources
Effectiveness and Efficiency Indicators
Effective Projects and Initiatives
- The College reduced the unrestricted fund deficit from $2.4 million as of June 30, 2003, to $236,000 as of June 30, 2008, with almost a $1 million reduction over the last two years.
- The College received nearly $425,000 in energy-efficient lighting and installation from NStar to reduce electricity consumption. Savings will be realized in FY2009 and beyond.
- The College partnered with Bentley University to install WiFi throughout the campus, with Bentley students teaching RCC students and faculty to take advantage of the new system. The College received a grant from a donor to allow library check-out of over 40 laptops so that students can take advantage of the WiFi throughout the campus and communicate with one another within Learning Communities.
Resource Allocation
Expenditures per Student—Actual, National Peers, and Budget Formula
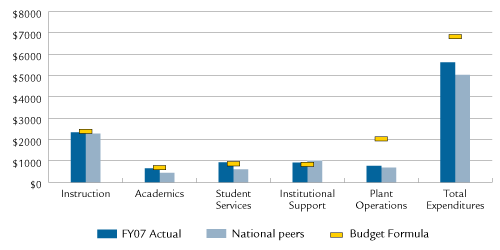
Note: This graphic was revised on May 6, 2009. The previously posted graphic displayed the data inaccurately.
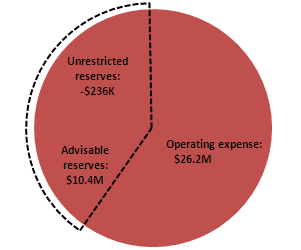
FY2008 Primary Reserve Ratio
| Unrestricted Reserves (UR) |
-$236,416 |
| Total Operating Expenses (TOE) |
$26,239,795 |
| Primary Reserve Ratio (UR/TOE) |
-0.9% |
Primary Reserve Ratio
Compliance
No materials weaknesses based on annual external independent audit:

