Mount Wachusett Community College
Mount Wachusett Community College (MWCC) unites education, technology, enterprise and community service to advance lifelong learning, develop human potential and stimulate economic vitality in a changing world. The College offers over 50 associate's degree and certificate programs, adult basic education/GED programs, training for business and industry and non-credit community service programs.
Program of Distinction
Collaborations
Access Indicators
Affordability Indicators
Student Success and Academic Quality Indicators
Fiscal Effectiveness and Efficiency Indicators
Program of Distinction
Mount Wachusett Community College (MWCC) was named to the 2007 President's Higher Education Community Service Honor Roll, with Distinction, a national honor granted to colleges and universities with exemplary community service activities, and one of just 127 nationwide named with distinction. The Honor Roll is a program of the Corporation for National and Community Service and is sponsored by the U.S. Department of Education, the U.S. Department of Housing and Urban Development, the USA Freedom Corps and the President's Council on Service and Civic Participation. Honorees for the award are selected based on a series of selection factors including scope and innovativeness of service projects, percentage of student participation in service activities, incentives for service, and the extent to which the school offers academic service learning courses. Nearly 500 MWCC students collectively volunteered more than 8,500 hours this academic year on service learning projects benefiting children, adults and organizations throughout north central Massachusetts.
Collaborations
- MWCC's new Upward Bound Math Science program serves 50 area high school students who have an aptitude for math and science, are from first generation college families, and/or are income eligible. Last fall, MWCC received a $1 million grant from the U.S. Department of Education for a four-year initiative. The goal is to help students develop their potential in math and science and encourage them to pursue postsecondary degrees in these subject areas. The students meet throughout the academic year for academic advising, counseling and mentoring, MCAS and SAT preparation, math and science research projects, financial aid and scholarship workshops and educational and cultural field trips. During the summer, they participate in a residential component hosted at Fitchburg State College. In addition to Fitchburg State, other partners providing academic and career opportunities include Heywood Hospital, NYPRO Industries, and UMass Lowell.
- MWCC and Nichols College have established an "Associate's to Bachelor's" Business Program that began in fall 2008. Under the agreement, MWCC students who enroll in the program will be jointly admitted to Nichols. After earning an Associate Degree in Business at MWCC, students will complete a third year of business coursework at MWCC and then transfer all 90 credits - equal to three years - to Nichols College and pursue a Bachelor of Science in Business Administration degree in their fourth year. Program flexibility is a significant advantage to the student, as fourth-year coursework taught by Nichols professors can be completed on the MWCC campus, on Nichols' campus in Dudley or through Nichols' online program.
- MWCC was awarded a $1.6 million federal grant from the U.S. Department of Labor under the President's Community-Based Job Training Grants Initiative to expand its Biotechnology/ Biomanufacturing program in collaboration with Bristol-Myers Squibb. The Biotechnology/ Biomanufacturing Partnership will develop career ladders and curricula to link pre-employment, certificate, and associate degree programs in biotechnology and biomanufacturing technology. Specifically, the partnership will facilitate outreach programs in high schools and One-Stop Career Centers to expose youth and adults to career opportunities, and will equip labs and hiring training faculty. This funding will support the training of approximately 190 students who will be trained at the Devens campus. MWCC is one of 69 community colleges and community-based institutions to receive one of the competitively awarded grants totaling $125 million, and is the only Massachusetts organization selected in this third round of funding.
- MWCC's Summer Up program provides summer employment, field trips and leadership training to middle and high school students as well as safe recreation spaces, activities, and meals for program participants and the hundreds of area children ages four and above who attend the free six-week program. Summer Up is designed to decrease unsafe behaviors by providing meaningful service to nine sites in four communities. Last year, 135 middle school and high school students served in the recreation work program; and 450 elementary school children from Fitchburg, Leominster, Gardner and Winchendon participated in the activities and lunch program. The program is partially funded by a federal GEAR UP grant and also relies on community contributions.
- Through a federal Compassion Capital Fund (CCF) grant, MWCC's Institute for Nonprofit Development re-granted $80,000 to 11 area social service agencies. The agencies will receive training and assistance in the five critical areas of capacity building: leadership development; organizational development; program development; revenue development strategies; and community engagement. The Institute for Nonprofit Development, part of the Center for Democracy and Humanity at MWCC, is an intermediary organization of the CCF.
Section I: Access to Public Higher Education in Massachusetts
Access Indicators
Fall 2007 Enrollment
| Headcount |
4,147 |
| FTE |
2,524 |
Fall Enrollment
Over the last three years, fall headcount enrollment has remained relatively stable.
Over the last three years, fall full-time equivalent (FTE) enrollment has decreased 2.4%.
Annual 2007–2008 Enrollment
| Headcount |
5,882 |
| FTE |
2,610 |
Annual Enrollment
Over the last three years, annual headcount enrollment has increased 5.3%.
Over the last three years, annual FTE enrollment has increased 4.5%.
Looking Back: Fall and Annual Headcount Enrollment

Fall 2007 Minority Enrollment
19%
Minority Enrollment
Greater than the minority representation of the institution's primary draw cities and towns (17.3%) and the Central Region's minority representation of 11.8%.
Section II: Affordability of Massachusetts Community Colleges
Affordability Indicator
2007–2008 Tuition and Fees as a Percent of Median Family Income
5.6%
% of Median Family Income
Comparable to the Northeast regional average of 4.9%.
Looking Back: Tuition and Fees as a Percent of Median Family Income
|
FY2004 |
FY2005 |
FY2006 |
FY2007 |
FY2008 |
| Mount Wachusett Community College Tuition and Fees |
$4,010 |
$4,010 |
$3,970 |
$4,120 |
$4,420 |
| State Median Family Income |
$67,527 |
$68,701 |
$71,655 |
$74,463 |
$78,497 |
| "X" as a Percent of State Median Family Income |
| X = Mount Wachusett Community College Tuition and Fees |
5.9% |
5.8% |
5.5% |
5.5% |
5.6% |
| X = Massachusetts Community Colleges' Average Tuition and Fees |
4.8% |
4.9% |
4.9% |
4.7% |
4.7% |
| X = Northeast Average Tuition and Fees |
|
4.8% |
4.8% |
4.9% |
4.9% |
Section III: Student Success and Academic Quality
Success and Quality Indicators
Fall 2006 Cohort First-Year Persistence Rate
| Retained at original institution |
52.6% |
| Retained at any institution |
64.2% |
Fall Cohort First-Year Persistence
Persistence at original institution has increased 4 percentage points over the last three years but is below the segmental average of 56.5%.
Looking Back: Fall-to-Fall First-Year Persistence Rate

Fall 2003 Cohort Four-Year Overall Success Rate
72.4%
Fall 2003 Cohort Four-Year Individual Success Rates
| Earned Degree/Certificate |
40.6% |
| Transferred |
11.3% |
| Earned 30 Credits |
18.9% |
| Still Enrolled |
1.6% |
| Note: Each subsequent category excludes any student included in previous category(ies) |
Fall Cohort Four-Year Overall Success Rate
This new indicator measures students who have earned a degree/certificate, transferred to another institution, earned 30 or more credits, or are still enrolled after four years. Future reports will include these outcomes over four, five, and six years for this and successive cohorts. Please see the Technical Guide for further details regarding this indicator.
2007–2008 Fall-to-Spring Retention Rate
86.7%
Fall-to-Spring Retention Rate
Fall-to-spring retention has remained relatively stable over the last three years.
FY2008 Credit Course Completion Rate
81.1%
Course Completion
Above the Board of Higher Education's target rate of 75%.
Total Degrees Conferred in FY2008
642
Degrees Conferred
Average degrees conferred per year over the last three years: 673
Looking Back: Degrees Conferred

2007 Pass Rate on the National Nursing Licensure Examination
80.6%
Nursing Exam Pass Rate
Below the Board of Higher Education's target pass rate of 85%.
FY2008 Annual Enrollment in Workforce Development Courses
12,579
Workforce Development
Average annual enrollment in workforce development courses per year over the last three years: 8,141
Section IV: Effective and Efficient Use of Resources
Effectiveness and Efficiency Indicators
Effective Projects and Initiatives
- MWCC's Division of Lifelong Learning and Workforce Development has brought nearly $540,000 to the region since July 1 by helping area businesses successfully apply for state Workforce Training Fund grants. Since 2005, the college has brought in $2.4 million in workforce training money for more than 40 area organizations.
- MWCC continues to be a leader in renewable energy and sustainability. The conversion of its all-electric campus to a biomass system has resulted in cumulative savings of over 26.9M kWh of electricity and 13.8M gals of water with a dollar value of over $2.93M. MWCC has reduced CO2 emissions by 11,000 tons; NOx by 18 tons and SOx by 47 tons. These reductions are equivalent to planting 3,012 acres of trees and removing 1920 cars from the roads.
Resource Allocation
Expenditures per Student—Actual, National Peers, and Budget Formula
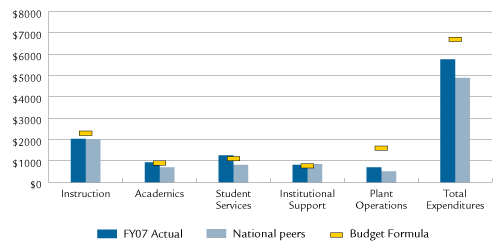
Note: This graphic was revised on May 6, 2009. The previously posted graphic displayed the data inaccurately.
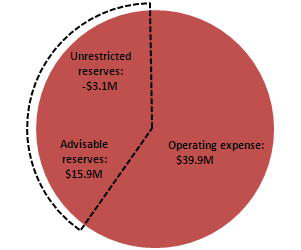
FY2008 Primary Reserve Ratio
| Unrestricted Reserves (UR) |
-$3,118,151 |
| Total Operating Expenses (TOE) |
$39,965,463 |
| Primary Reserve Ratio (UR/TOE) |
-7.8% |
Primary Reserve Ratio
Compliance
No materials weaknesses based on annual external independent audit:

