Bunker Hill Community College
Bunker Hill Community College (BHCC) supports open access to post-secondary education by providing a range of educational opportunities, including distance and self-directed learning and an honors program. The student body reflects the diversity of the urban community. An essential part of the College’s mission is to encourage this diversity. The College is a model for successfully incorporating the strengths of many cultures, backgrounds, ages and learning styles into the life of the institution.
Program of Distinction
Collaborations
Access Indicators
Affordability Indicators
Student Success and Academic Quality Indicators
Fiscal Effectiveness and Efficiency Indicators
Program of Distinction
Two student success initiatives, Achieving the Dream: Community Colleges Count and Building the Engaged Campus, funded by $2,337,063 in grants from the U.S. Department of Education (Title III), the Lumina Foundation for Education, The Boston Foundation, the Lloyd G. Balfour Foundation, TERI, the Irene E. & George A. Davis Foundation and others, have enabled Bunker Hill Community College (BHCC) to establish learning communities as a central and unifying feature. Assessment data is informing teaching and learning improvements within learning communities, promoting best practices that lead to student retention and success, and providing a measure for gauging increased engagement and institutional effectiveness. More than 200 faculty and staff serve on teams that have examined the BHCC student experience and researched models and best practices, and they are implementing changes that are reshaping BHCC’s teaching and learning environment. To date, 604 students have enrolled in 25 new learning communities supported by integrated student services and a robust professional development program.
Collaborations
- In spring 2008, BHCC collaborated with four high schools—Madison Park, Quincy Upper, Charlestown, and J.E. Burke—and the Boston Day/Evening Adult Learning Center to help seniors transition to college. These 300 students were part of a new registration process including on-the-spot acceptance; guidance on financial aid; information on placement testing; and orientation to online services including registration, payment, course planning, transcript review and the use of a BHCC email account. Students were assisted with online registration and given detailed information on the value of learning community seminars and learning community clusters. The seminars are designed to help first-time, full-time students make a successful transition to college by building relationships and developing skills and strategies necessary for college success. All students were encouraged to attend an orientation and tour of the facilities. Of the 300 participating students, 90 students enrolled in fall 2008.
- Addressing a current need to serve nearly 50% of the patients at the East Boston Neighborhood Health Clinic for whom English is a second language, BHCC and the East Boston Clinic have partnered with “Pathways for Frontline Workers” in a Jobs to Careers project to train medical interpreters. This credit-bearing program for current employees of the clinic provides classroom education in medical terminology and work-based practice under the supervision of interpreters/preceptors in communication with patients. This certificate program is being offered to Medical Assistants, Elder Service Plan Aides and Clerical Associates. The newly trained Certified Auxiliary Interpreters will replace children, friends and other laypersons who are currently the only source of language help for non-English speaking patients who need to have meaningful discussions with their health care providers. Starting at the East Boston Clinic, the program can be easily replicated in other sites.
- A total of 1,064 students participated in academic service learning and nonacademic service at BHCC. Furthermore, BHCC hired a full-time Coordinator of Community Engagement. In addition to being selected to the President’s Higher Education Community Service Honor Roll, five students will engage in paid internships at local community organizations, earning $1,000 for completing 300 hours of service. A signature program involves student volunteers who worked in collaboration with other areas of the college to support an outside group of architects and builders who constructed artistic and complex structures for an annual competition entitled, “Canstruction.” Following the Canstruction exhibit, over 40,000 meals were donated to families. BHCC volunteers delivered canned goods to local food pantries, assembled bags of food and served hot meals to people in the East End House, The Harvest on Vine, Community Servings and Harvest Food Pantry at Cambridgeport Baptist Church.
- Through a partnership between BHCC and Partners Healthcare Collaboration, three online certificate programs are being offered to help prepare Radiology Technologists to add additional credentials to their professional competencies. Funded by the Boston Foundation, this program trains technologists to be licensed in Computed Tomography, Mammography and Magnetic Resonance Imaging. The online program provides flexible access to didactic coursework and a work-based approach to clinical practice. Completion of the certificate program will prepare practitioners for the American Registry of Radiologic Technologists’ post-primary certification exams. The first cohort will be eligible to take the test and apply for upgraded positions this year.
Section I: Access to Public Higher Education in Massachusetts
Access Indicators
Fall 2007 Enrollment
| Headcount |
8,806 |
| FTE |
4,813 |
Fall Enrollment
Over the last three years, fall headcount enrollment has increased 12.4%.
Over the last three years, fall full-time equivalent (FTE) enrollment has increased 11.8%.
Annual 2007–2008 Enrollment
| Headcount |
13,627 |
| FTE |
5,538 |
Annual Enrollment
Over the last three years, annual headcount enrollment has increased 10.4%.
Over the last three years, annual FTE enrollment has increased 10.9%.
Looking Back: Fall and Annual Headcount Enrollment

Fall 2007 Minority Enrollment
57.9%
Minority Enrollment
Greater than the minority representation of the institution's primary draw cities and towns (35%) and the Greater Boston Region's minority representation of 21%.
Section II: Affordability of Massachusetts Community Colleges
Affordability Indicator
2007–2008 Tuition and Fees as a Percent of Median Family Income
4.1%
% of Median Family Income
Below the Northeast regional average of 4.9%.
Looking Back: Tuition and Fees as a Percent of Median Family Income
|
FY2004 |
FY2005 |
FY2006 |
FY2007 |
FY2008 |
| Bunker Hill Community College Tuition and Fees |
$3,000 |
$3,000 |
$3,000 |
$3,000 |
$3,180 |
| State Median Family Income |
$67,527 |
$68,701 |
$71,655 |
$74,463 |
$78,497 |
| "X" as a Percent of State Median Family Income |
| X = Bunker Hill Community College Tuition and Fees |
4.4% |
4.4% |
4.2% |
4.0% |
4.1% |
| X = Massachusetts Community Colleges' Average Tuition and Fees |
4.8% |
4.9% |
4.9% |
4.7% |
4.7% |
| X = Northeast Average Tuition and Fees |
|
4.8% |
4.8% |
4.9% |
4.9% |
Section III: Student Success and Academic Quality
Success and Quality Indicators
Fall 2006 Cohort First-Year Persistence Rate
| Retained at original institution |
52.9% |
| Retained at any institution |
62.6% |
Fall Cohort First-Year Persistence
Persistence at original institution has increased 3.1 percentage points over the last three years but is below the segmental average of 56.5%.
Looking Back: Fall-to-Fall First-Year Persistence Rate

Fall 2003 Cohort Four-Year Overall Success Rate
65.8%
Fall 2003 Cohort Four-Year Individual Success Rates
| Earned Degree/Certificate |
24.3% |
| Transferred |
17.9% |
| Earned 30 Credits |
21.8% |
| Still Enrolled |
1.8% |
| Note: Each subsequent category excludes any student included in previous category(ies) |
Fall Cohort Four-Year Overall Success Rate
This new indicator measures students who have earned a degree/certificate, transferred to another institution, earned 30 or more credits, or are still enrolled after four years. Future reports will include these outcomes over four, five, and six years for this and successive cohorts. Please see the Technical Guide for further details regarding this indicator.
2007–2008 Fall-to-Spring Retention Rate
89.1%
Fall-to-Spring Retention Rate
Fall-to-spring retention has remained relatively stable over the last three years.
FY2008 Credit Course Completion Rate
76.2%
Course Completion
Above the Board of Higher Education's target rate of 75%.
Total Degrees Conferred in FY2008
814
Degrees Conferred
Average degrees conferred per year over the last three years: 771
Looking Back: Degrees Conferred

2007 Pass Rate on the National Nursing Licensure Examination
61.7%
Nursing Exam Pass Rate
Below the Board of Higher Education's target pass rate of 85%.
FY2008 Annual Enrollment in Workforce Development Courses
3,900
Workforce Development
Average annual enrollment in workforce development courses per year over the last three years: 3,437
Section IV: Effective and Efficient Use of Resources
Effectiveness and Efficiency Indicators
Effective Projects and Initiatives
- Negotiated a five-year fixed-price contract for electricity that resulted in a savings of $170,000 for FY2008.
- Increased investment in Capital Assets by $1.6 million to extend life of existing physical plant and equipment.
- Upgraded lighting and motor controls that resulted in annual electricity savings of eight percent.
- Implemented an improved computer power management system that resulted in $50,000 per year energy savings.
Resource Allocation
Expenditures per Student—Actual, National Peers, and Budget Formula
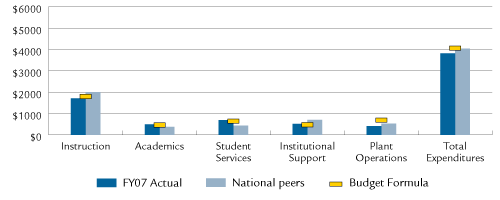
Note: This graphic was revised on May 6, 2009. The previously posted graphic displayed the data inaccurately.
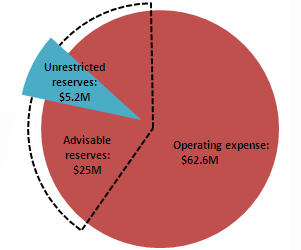
FY2008 Primary Reserve Ratio
| Unrestricted Reserves (UR) |
$5,276,303 |
| Total Operating Expenses (TOE) |
$62,636,295 |
| Primary Reserve Ratio (UR/TOE) |
8.4% |
Primary Reserve Ratio
Compliance
No materials weaknesses based on annual external independent audit:

