Policy and Report Library > Reports > 2008 Performance Measurement Report
Massachusetts College of Liberal Arts
Designated in 1997 as "the public liberal arts college of Massachusetts," MCLA is one of only 25 so-designated institutions in the country and is a member of COPLAC, the Council of Public Liberal Arts Colleges. MCLA offers Bachelor of Arts, Bachelor of Science and Master's of Education degrees, along with extensive professional development opportunities to our region's teachers and K-12 administrators. MCLA delivers a high quality, affordable education that focuses on building critical thinking and communication skills that are of great value to our graduates' development, to their community, and to their future employers. This rich academic experience also is prevalent in our professional degree programs. As a public liberal arts college, our promise is a commitment to prepare students for success at work and in life.
Program of Distinction
Collaborations
Access Indicators
Affordability Indicators
Student Success and Academic Quality Indicators
Fiscal Effectiveness and Efficiency Indicators
Program of Distinction
A group of MCLA students, along with Art History Professor Tony Gengarelly, produced a major publication: Exploring Nirvana: The Art of Jessica Park, which highlights artist Jessica Park's career and lifelong struggle with autism. The book began in spring 2004 as a project of Gengarelly's advanced museum studies class after an exhibition of Park's art was displayed in the College's Porter Street gallery. Students did research about autism and Park, wrote essays about her paintings, developed a book layout and raised money to support the 96-page volume, which includes entries from nationally recognized autism experts. The book was launched last May at an exhibition of Park's work in MCLA Gallery 51. In February 2009, The Art and Life of Jessica Park, a traveling art exhibition to provide a context for the release and marketing of the book, will open at Endicott College.
Collaborations
- MCLA students serve as writing mentors in a partnership between MCLA, Inkberry Inc. and North Adams Conte Middle School. The purpose of "The Write Stuff" is to enhance the writing skills of seventh graders. MCLA student coordinators, Inkberry staff members and a Conte teacher work together to develop lesson plans, identify teaching resources, conduct training sessions and match middle school students with 20 mentor volunteers. The mentors meet weekly in the Conte library for one-on-one or one-on-two writing tutorials. The middle school students also participate in monthly theme-based field trips, which include visits to the MCLA campus. At the end of each semester, the seventh graders read their writings at an "Author's Night." In addition, the North Adams Transcript, a local newspaper, publishes the students' writings twice a year.
- "Take Charge" is a collaborative effort between MCLA, the Northern Berkshire Community Coalition, Williams College, the Center for Ecological Technology, and several area businesses. This campaign is part of a community effort dedicated to conserving energy and promoting renewable energy, and educates the community on ways to save money and meet a variety of energy challenges. More than 120 volunteers from MCLA, Williams College and the community have winterized 46 homes in the area. Area high school students also work with middle and elementary school students to increase their energy awareness. "Take Charge" empowers residents to learn about ways to conserve and manage resources, and how to take no-cost or low-cost measures to make their homes more efficient, more comfortable and more affordable to live in.
- The Berkshire Compact for Higher Education, a county-wide initiative under the leadership of MCLA , was created to ensure that all residents of this region aspire to 16 years of education. MCLA led the effort for the Compact and successfully executed the first milestone of the Berkshire Passport (a component of the Compact that will promote college awareness, starting early in a child's education) - Berkshire County Goes to College Day. This past April, 1,200 sixth graders spent the day at one of the four colleges in the county; MCLA, Berkshire Community College, Bard College of Simon's Rock and Williams College. During this inaugural visit, the sixth graders were able to meet college students and faculty, tour the campuses and engage in a variety of activities including creating a mock television show, feeding sea anemones, and participating in chemistry experiments. The program exposed middle school students to a variety of academic disciplines and experiences, and helped build an early awareness of college.
- MCLA partnered with the City of North Adams, MASS MoCA and the Northern Berkshire Community Coalition for DownStreet Art, an array of art exhibitions to celebrate art in downtown North Adams June 26 through October 31, 2008. The project featured, for the first time, a map of all the visual art destinations in the area, including four new contemporary art spaces. New spaces included work by artist Jarvis Rockwell; an exhibition of art by the Sol LeWitt project's professional apprentices from MASS MoCA; the North Adams Artists' Cooperative Gallery; and Lumens, an interactive, networked installation by local artists presented by MCLA Gallery 51, Greylock Arts and Turbulence. The effort brought nearly 14,000 visitors to the downtown galleries, and area businesses saw a notable increase in foot traffic and sales.
Section I: Access to Public Higher Education in Massachusetts
Access Indicators
Fall 2007 Enrollment
| Undergraduate Headcount |
1,550 |
| Undergraduate FTE |
1,407 |
| Graduate Headcount |
291 |
| Graduate FTE |
137 |
Fall Enrollment
Over the last three years, total fall headcount enrollment has remained relatively stable. Over the same time period, undergraduate fall headcount enrollment has increased 8.0%.
Over the last three years, total fall full-time equivalent (FTE) enrollment has increased 2.1%. Over the same time period, undergraduate fall FTE enrollment has increased 8.2%.
Annual 2007–2008 Enrollment
| Undergraduate Headcount |
1,793 |
| Undergraduate FTE |
1,383 |
| Graduate Headcount |
789 |
| Graduate FTE |
326 |
Annual Enrollment
Over the last three years, total annual headcount enrollment has decreased 6.5%. Over the same time period, undergraduate annual headcount enrollment has increased 4.5%.
Over the last three years, total annual FTE enrollment has decreased 4.4%. Over the same time period, undergraduate annual FTE enrollment has increased 4.4%.
Looking Back: Undergraduate and Graduate Fall Headcount Enrollment

Fall 2007 Minority Enrollment
9.3%
Minority Enrollment
Greater than the Berkshire Region's minority representation of 4.6%.
Fall 2007 Community College Transfer Students
90
Community College Transfer Students
Over the last three years, the number of community college transfer students has decreased 15.9%.
Section II: Affordability of Massachusetts Community Colleges
Affordability Indicator
2007–2008 Tuition and Fees as a Percent of Median Family Income
7.9%
% of Median Family Income
Below the Northeast regional average of 9.1%.
Looking Back: Tuition and Fees as a Percent of Median Family Income
|
FY2004 |
FY2005 |
FY2006 |
FY2007 |
FY2008 |
| Massachusetts College of Liberal Arts Tuition and Fees |
$5,397 |
$5,417 |
$5,616 |
$5,926 |
$6,168 |
| State Median Family Income |
$67,527 |
$68,701 |
$71,655 |
$74,463 |
$78,497 |
| "X" as a Percent of State Median Family Income |
| X = Massachusetts College of Liberal Arts Tuition and Fees |
8.0% |
7.9% |
7.8% |
8.0% |
7.9% |
| X = Massachusetts State Colleges' Average Tuition and Fees |
6.7% |
7.3% |
7.5% |
7.8% |
7.7% |
| X = Northeast Average Tuition and Fees |
|
9.2% |
9.3% |
9.3% |
9.1% |
Section III: Student Success and Academic Quality
Success and Quality Indicators
Fall 2006 Cohort First-Year Retention Rate
71.5%
Fall Cohort First-Year Persistence
Below the segmental rate of 74.4% and the institutional peer retention rate of 78.5%, but comparable to the national rate of 71.9%.
Looking Back: Fall-to-Fall Retention Rate
|
Cohort |
|
Entering 2002 |
Entering 2003 |
Entering 2004 |
Entering 2005 |
Entering 2006 |
| Massachusetts College of Liberal Arts Rate |
76.5% |
73.6% |
72.6% |
71.0% |
71.5% |
| Peer Rate |
|
82.1% |
77.9% |
75.7% |
78.5% |
| Massachusetts State Colleges Segment Rate |
74.6% |
75.2% |
76.2% |
73.5% |
74.4% |
| National Average |
|
71.1% |
70.3% |
70.0% |
71.9% |
1999–2001 Cohort Six-Year Graduation Rate (3-Year Average)
48.3%
Six-Year Graduation Rate
Comparable to the segmental rate of 47.3% but below the institutional peer rate of 56.8%.
Looking Back: Six-Year Graduation Rate
|
Cohort |
|
|
Entering 1998
Grad. by 2004 |
Entering 1999
Grad. by 2005 |
Entering 2000
Grad. by 2006 |
Entering 2001
Grad. by 2007 |
Rolling Average Entering 1999– 2001 |
| Massachusetts College of Liberal Arts Rate |
45.0% |
47.3% |
51.3% |
46.3% |
48.3% |
| Peer Rate |
53.2% |
53.8% |
56.6% |
60.1% |
56.8% |
| Massachusetts State Colleges Segment Rate |
47.6% |
47.2% |
48.9% |
45.9% |
47.3% |
Total Degrees Conferred in FY2008
364
Degrees Conferred
Average degrees conferred per year over the last three years: 347
Looking Back: Degrees Conferred

2007 Pass Rate on the Massachusetts Test for Educator Licensure
98%
Number of Students Passing MTEL
44
Massachusetts Test for Educator Licensure Pass Rate
Above the Board of Higher Education's target pass rate of 80%.
Percent of New Students Who Were Special Admits in Fall 2007
9.4%
Special Admissions Students
Meets the Board of Higher Education requirement of enrolling less than 10% special admissions students per year. (See Appendix.)
Section IV: Effective and Efficient Use of Resources
Effectiveness and Efficiency Indicators
Effective Projects and Initiatives
- Continued to work with The Center for Ecological Technology, to implement opportunities to reduce our footprint through energy conservation and recycling efforts, including the installation of the following: energy efficient lighting in the Freel Library, Church Street Center, and Wellness Center, energy efficient hot water system in the Campus Center, three solar powered emergency phones in campus parking lots, and an energy efficient dishwasher for food service use.
- All Admission staff travel in Prius Hybrid cars either college owned or leased. Vehicles are also used for other college travel during the fall.
Resource Allocation
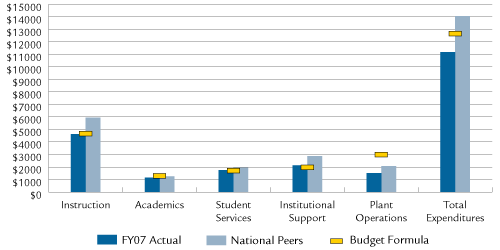
Expenditures per Student—Actual, National Peers, and Budget Formula

Note: This graphic was revised on May 6, 2009. The previously posted graphic displayed the data inaccurately.
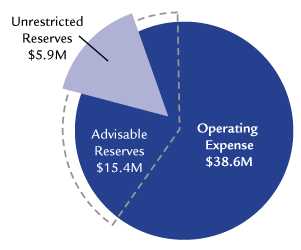
FY2008 Primary Reserve Ratio
| Unrestricted Reserves (UR) |
$5,920,547 |
| Total Operating Expenses (TOE) |
$38,693,917 |
| Primary Reserve Ratio (UR/TOE) |
15.3% |
Primary Reserve Ratio

Compliance
No materials weaknesses based on annual external independent audit:

